By Braden Keith on SwimSwam

The National Federation of State High School Associations has released its High School Athletics Participation Survey for the 2023-2024 school year. Swimming and diving had a combined 254,973 participants, which slipped around 2,500 from the 2022-2023 school year and marked the fourth-straight survey in which participation had declined.
Note that the data is based on surveys of high school athletics directors, so is not exact.
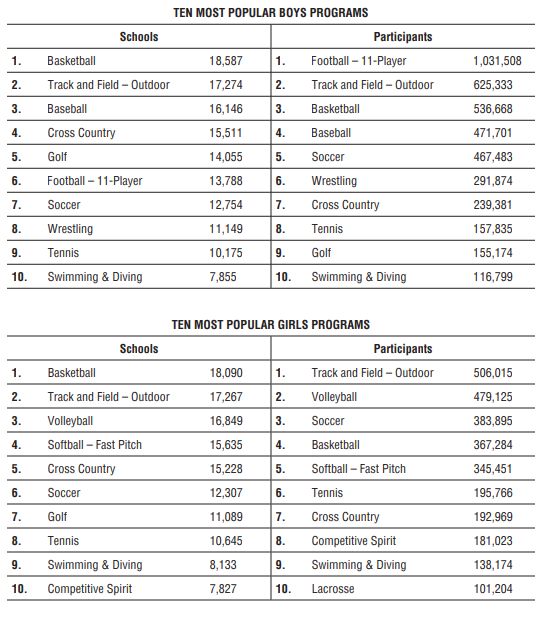
Swimming remained as the 10th-most popular sport for boys by both number of school sponsoring and number of participants and 9th-most popular for girls.
The trend of declining participation in swimming is part of a broader nationwide trend of decreasing participation in high school sports. The decline began before the COVID-19 pandemic but was accelerated in the 2019-2020 and 2020-2021 season. A combination of declining interest in sports generally, and the dominance of club sports is credited with much of that decline, though many sports have begun to recover post-pandemic.
Recent years have also seen a general downward trend in USA Swimming membership.
Many other sports also saw declines, though the notable exception is track & field, which has seen big leaps in each of the last two years and is back above pre-pandemic participation numbers. Soccer, weightlifting, football, and wrestling were also bright spots in the participation numbers.
Water polo saw a small increase as well in the 2023-2024 season.
It’s not all bad news for swimming & diving programs, though: boys swimming actually saw a small uptick from last year (within the margin of surveying error), and both boys’ and girls’ swimming have more participating schools than they did pre-pandemic. Boys swimming schools jumped from 7,704 in 2018-2019 to 7,855 in 2023-2024, while girls jumped from 8,007 to 8,133 in the same time period.
Swimming Participation Change Over Time
| Boys | Girls | Combined | Percentage Changed (Combined) | |
| 2023-2024 | 116,799 | 138,174 | 254,973 | -0.96% |
| 2022-2023 | 116,741 | 140,711 | 257,452 | -5.68% |
| 2021-2022 | 123,208 | 149,751 | 272,959 | -11.87% |
| 2018-2019 | 136,638 | 173,088 | 309,726 | -1.53% |
| 2017-2018 | 138,935 | 175,594 | 314,529 | 1.74% |
| 2016-2017 | 138,364 | 170,797 | 309,161 | 2.98% |
| 2015-2016 | 133,470 | 166,747 | 300,217 | -1.22% |
| 2014-2015 | 137,087 | 166,838 | 303,925 | -0.07% |
| 2013-2014 | 138,373 | 165,779 | 304,152 | 0.66% |
| 2012-2013 | 138,177 | 163,992 | 302,169 | 2.68% |
| 2011-2012 | 133,823 | 160,456 | 294,279 | -0.17% |
| 2010-2011 | 133,900 | 160,881 | 294,781 | 1.72% |
| 2009-2010 | 131,376 | 158,419 | 289,795 |
Overall HS Sports Participation Over Time
| Boys | Girls | Combined | Percentage Changed (Combined) | |
| 2023-2024 | 4,638,785 | 3,423,517 | 8,062,302 | 2.73% |
| 2022-2023 | 4,529,795 | 3,318,184 | 7,847,979 | 3.02% |
| 2021-2022 | 4,376,582 | 3,241,472 | 7,618,054 | -4.02% |
| 2018-2019 | 4,534,758 | 3,402,733 | 7,937,491 | -0.54% |
| 2017-2018 | 4,565,580 | 3,415,306 | 7,980,886 | 0.22% |
| 2016-2017 | 4,563,238 | 3,400,297 | 7,963,535 | 1.24% |
| 2015-2016 | 4,541,959 | 3,324,306 | 7,866,265 | 0.76% |
| 2014-2015 | 4,519,312 | 3,287,735 | 7,807,047 | 0.15% |
| 2013-2014 | 4,527,994 | 3,267,664 | 7,795,658 | 1.06% |
| 2012-2013 | 4,490,854 | 3,222,723 | 7,713,577 | 0.27% |
| 2011-2012 | 4,484,987 | 3,207,533 | 7,692,520 | 0.32% |
| 2010-2011 | 4,494,406 | 3,173,549 | 7,667,955 | 0.52% |
| 2009-2010 | 4,455,740 | 3,172,637 | 7,628,377 |
Read the full story on SwimSwam: Boys Swimming Participation Up; Girls Swimming Participation Down in High School Sports